
What is Power BI service and its importance in Azure Data Analytics.
Power BI, developed by Microsoft, is a business intelligence tool for visualizing data. Users can connect to diverse data sources, clean and transform data, and create interactive reports with charts, graphs, and tables. Valuable for decision-making, it enables spotting trends and patterns. Power BI supports dashboards, offering an overview of key metrics. With data modeling, transformation features, and DAX language for calculations, it integrates with Excel, SQL databases, and online services. Useful for individuals and teams, Power BI empowers data-driven insights and effective communication of findings.
What are the available tools in Power BI?
Power BI offers a suite of tools for data analysis and visualization, including:
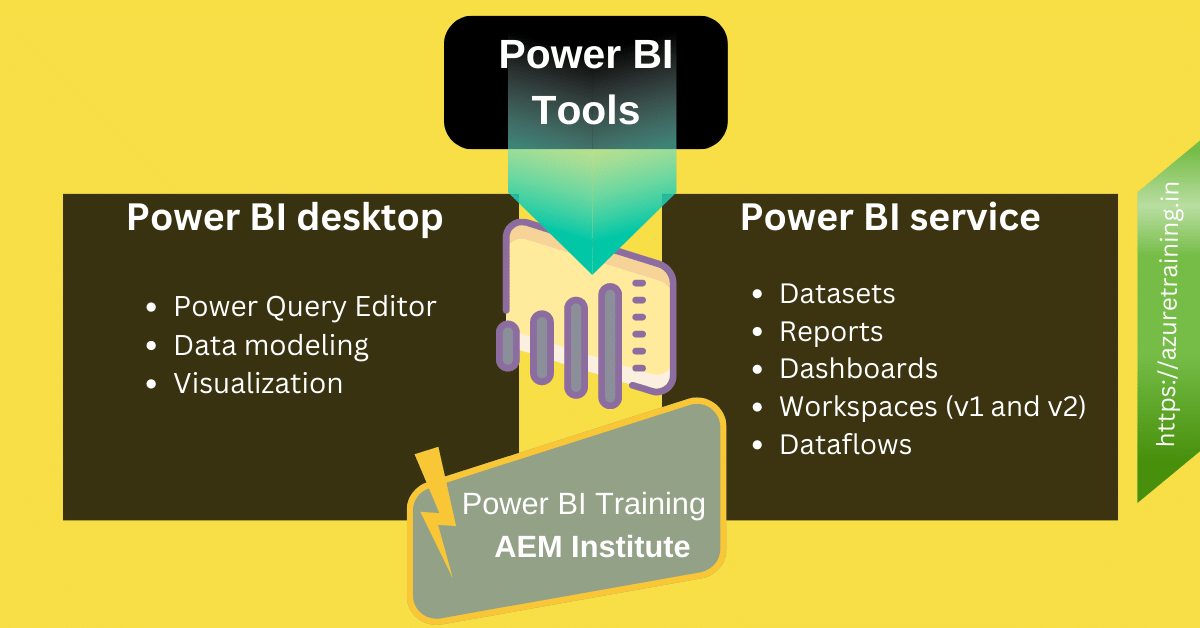
- Power BI Desktop: This is the primary tool for creating reports and visualizations. It provides a robust interface for data modeling, transformation, and designing interactive reports.
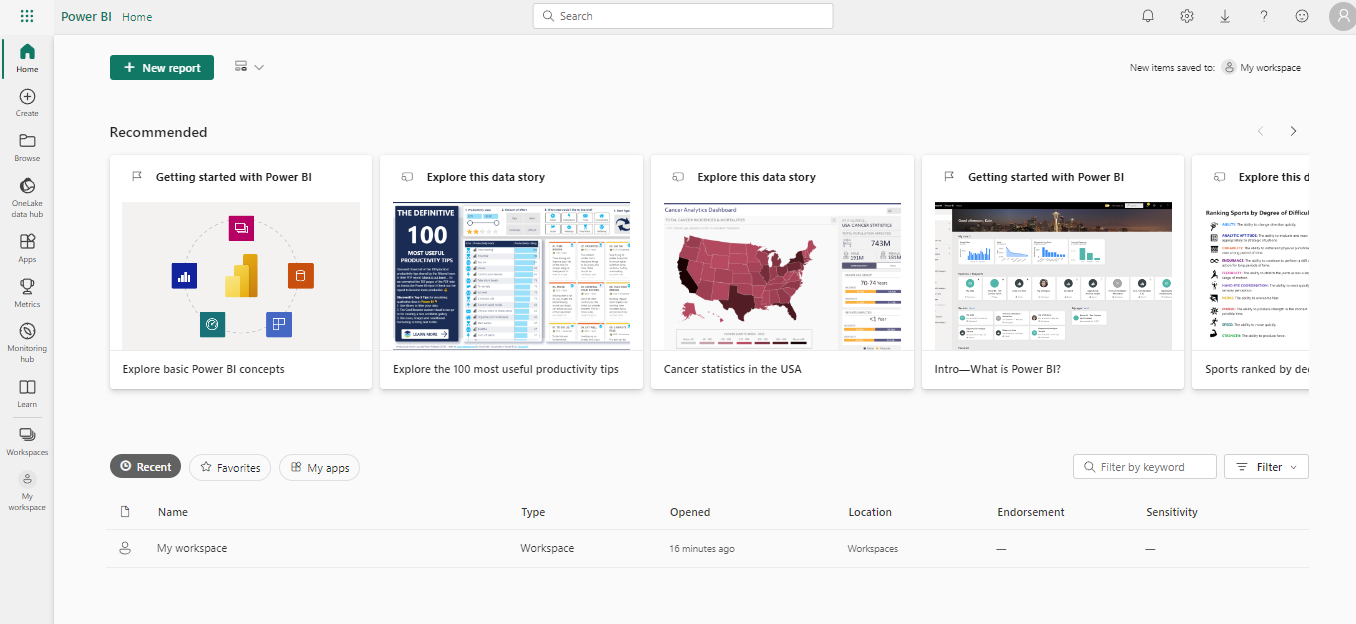
- Power BI Service: Also known as Power BI Online, it’s a cloud-based platform for sharing and collaborating on Power BI reports and dashboards. Users can access and interact with reports through web browsers or mobile apps.
- Power BI Mobile: Mobile apps for iOS and Android devices allow users to access and interact with Power BI reports and dashboards on the go.
- Power BI Gateway: It facilitates secure data transfer between on-premises data sources and the Power BI service. There are two types: Personal Gateway (for individual use) and Enterprise Gateway (for organizational use).
- Power BI Report Server: It enables on-premises hosting of Power BI reports, allowing organizations to manage and share reports within their own network.
- Power BI Embedded: Developers can embed Power BI reports and dashboards within custom applications, providing data insights to users without requiring them to leave the app.
- Power BI Dataflows: This tool lets users combine, transform, and load data from various sources to create reusable data transformations that can be used in Power BI reports.
- Power Query: Available in both Power BI Desktop and Excel, Power Query is used to connect to and transform data from different sources before loading it into the model.
- DAX (Data Analysis Expressions): This formula language is used for creating custom calculations, measures, and calculated columns within Power BI reports.
- Power BI Visuals Marketplace: A collection of custom visuals created by the community, which can be added to Power BI reports to enhance data visualization capabilities.
These tools collectively empower users to connect, transform, model, and visualize data, making informed decisions and sharing insights across the organization. If you are looking for a Power BI Training in Kolkata you may contact us.
Power BI Service – a Deep Dive
Power BI Service is a cloud-based platform by Microsoft that facilitates data collaboration, sharing, and interactive reporting. It comprises several key components:
- Dashboards: These offer a consolidated view of important metrics, combining visuals from various reports and datasets. Dashboards can be customized and shared with colleagues.
- Reports: Users can create interactive reports using Power BI Desktop and then publish them to the Power BI Service. Reports include a variety of visuals like charts, tables, and maps.
- Datasets: These are the foundation of Power BI reports, connecting to data sources and storing transformed data for analysis. Datasets can be created directly in the Power BI Service or uploaded from Power BI Desktop.
- Workspaces: Workspaces organize content, such as dashboards, reports, and datasets, into logical containers. They enable collaborative work by allowing users to share and collaborate on content within the workspace.
- Apps: Apps bundle related dashboards, reports, and datasets into a cohesive package, making it easier to distribute and consume specific insights.
- Sharing and Collaboration: Users can share dashboards and reports with colleagues, controlling access and permissions. Collaborators can leave comments and annotations on specific visuals to facilitate discussions.
- Q&A: The natural language query feature allows users to ask questions about their data in plain language and receive instant visual responses.
Power BI Service empowers organizations to share and collaborate on data insights, enabling informed decision-making and fostering a data-driven culture.
A comparison table between Power BI Desktop and Power BI Service:
| Aspect | Power BI Desktop | Power BI Service |
|---|---|---|
| Purpose | Create and design reports and visualizations locally | Share, collaborate, and access reports online |
| Installation | Installed on individual computer | Accessed through web browser |
| Data Modeling | Robust data modeling capabilities | Limited data modeling features |
| Data Connectivity | Connects to various data sources | Connects to data sources and on-premises data through gateways |
| Interactivity | Fully interactive reports and visuals | Interact with published reports |
| Collaboration | Limited collaboration features | Collaboration via sharing, comments, and collaboration workspaces |
| Dashboards | Limited dashboard capabilities | Create and share interactive dashboards |
| Real-time Data | Limited real-time data streaming | Real-time streaming and data refresh |
| Natural Language Q&A | Not available | Q&A for asking questions in natural language |
| Custom Visuals | Supports custom visuals | Supports custom visuals from marketplace |
| Dataflows | Not available | Create, manage, and share dataflows |
| Mobile Access | Limited mobile features | Access reports and dashboards on mobile devices |
| Scheduled Refresh | Limited scheduling of data refresh | Scheduled data refresh for reports |
Importance of Power BI Service in Data Analytics:
Power BI Service plays a crucial role in the realm of Data Analytics by providing a powerful cloud-based platform for sharing, collaborating, and deriving insights from data. Its importance can be outlined as follows:
- Centralized Data Accessibility: Power BI Service allows users to access reports and dashboards from anywhere with an internet connection. This accessibility ensures that critical data insights are available to decision-makers on-demand, enabling quick and informed decisions.
- Collaboration: The collaborative features of Power BI Service facilitate teamwork among users. Colleagues can collaborate in real-time on reports and dashboards, share insights, and provide feedback through comments, fostering a more data-driven and collaborative culture.
- Real-time Data Insights: Power BI Service offers real-time data streaming and scheduled data refresh options. This real-time capability ensures that decision-makers are working with the most current data, enabling them to respond swiftly to changing trends.
- Interactive Dashboards: Dashboards in Power BI Service provide a consolidated view of key performance indicators (KPIs) and metrics. These interactive dashboards make it easy to track performance trends and identify areas that need attention, enhancing data-driven decision-making.
- Data Exploration: Users can explore data using natural language queries. This feature simplifies data analysis by allowing users to ask questions in plain language and receive visual responses, democratizing data insights across various levels of technical expertise.
- Sharing Insights: Power BI Service empowers users to share reports and dashboards with stakeholders inside and outside the organization. This capability enhances transparency, ensuring that relevant parties have access to the same data-driven insights.
- Custom Visuals and Extensions: The integration of custom visuals and extensions extends the capabilities of Power BI reports. Users can create tailored visualizations to represent data in ways that suit their specific needs, enhancing the effectiveness of data communication.
- Scalability and Security: Power BI Service provides a secure and scalable environment for storing and sharing data. Organizations can manage user access, permissions, and data sources, ensuring that sensitive information is protected.
- Data Governance: With Power BI Service, organizations can implement data governance policies to maintain data accuracy, quality, and compliance. This is essential for maintaining the integrity of data analysis processes.
- Mobile Accessibility: The mobile app of Power BI Service enables users to access reports and dashboards on their mobile devices, ensuring that data insights are available even when users are on the move.
In conclusion, Power BI Service is instrumental in Data Analytics as it facilitates data sharing, collaboration, real-time insights, interactive visualization, and more, empowering organizations to make informed decisions and unlock the value hidden within their data.
How to create a Power BI Service account?
For creating a Power BI Service account you must have an organization mail ID. Login in the Microsoft website and provide email ID with valid mobile number. Just complete the verification and you are in.